Macro SAC untuk sinyal pergeseran
- Mengubah percepatan menjadi pergeseran
r *LHZ
rtrend
int
r more ! menghilangkan drift “penyok”
p1
- Mengubah sampling sinyal menjadi lebih kecil (down sampling)
SAC > qdp off
SAC > bd x
SAC > synch # memperjelas sinyal to synchronice the time all components
SAC > interpolate delta 0.5
SAC > p1
SAC > lh
DELTA : 5E-1
sebelumnya DELTA : 1E+0
NyQIST frequency = 1/(2*DELTA) = 1/ (2*0.5) = 1.0
NyQIST frequency adalah maksimum frequency. DELTA adalah sampling per second
SAC > decimate 2
Downsampling diperlukan untuk mengurangi harga filter sehingga benar-benar mendapatkan harga frekwensi corner yang layak. Nilai downsampling hanya sekitar 2 – 7.
- Prosedur untuk phase picking gelombang P dan S
SAC > r
coco.sac
SAC >
lh DIST
Ubah
dalam bentuk degree DEG = DIST / 111.267
Lihat
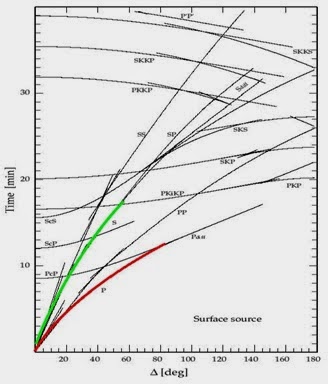
dalam Tabel Jeffrey Bullens (Gambar 1) untuk DEGREE
sehingga dapat diketahui kapan waktu kedatangan gel P
dan S
Misal
: COCO
DEG = 1.201442e+03
/ 111.267 = 10.8
dalam
tabel didapatkan waktu gel P = 3.70 dan S = 5.80
Kemudian observasi sinyal secara
manual untuk mendapatkan nilai waktu sebenarnya
SAC > bd x
SAC >
qdp off
SAC >
r coco.sac
SAC >
synch
SAC >
ppk ----------> pick gel P dan S
SAC >
lh
Bandingkan hasil obs dengan tabel, usahakan deviasi tidak
terlalu jauh (+/- 40 dtk)
SAC >
w over
menimpa nama file
lama
SAC >
ch a -12345 t0 -12345
menghapus picking dan kembali ke sinyal asli
- Untuk mengubah dari gambar sac menjadi ps file:
bd
sgf # start sac graphics file (sgf)
p1
sgftops
f001.sgf COCO_enr.ps # convert to sgf to
ps file
quit
from sac
rm -f
*.sgf # remove sgf files
gs
COCO_enr.ps
- Membuat label judul, absis, dan ordinat
title on
xlabel
"Time @(s@)"
ylabel
"Velocity @(nm/s@)"
* set
the xlabel and ylabel
ylim all
* set
the y-axis to be the same
xlim o o
+8
set the time axis to be from
origin time to 8 sec after the origin time
Gabungkan tiga komponen sekaligus
rm -f
*.sgf
setbb
sacfile "$sta$.*" #setbb
sacfile "$sta$.[zne]"
setbb
psfile "$sta$_3c.eps" #set
three component data
qdp off
r
COCO.sac
rmean
bp p 2 n
4 c 1 10 #4th order bandpass butterworth filter with 1 - 10 Hz
setbb ds
'( concatenate ' &1,kstnm ' ' &1,kzdate ' ' &1,kztime ' ) '
evaluate
to r &1,dist
title '(
concatenate ' %ds% ' ', dist = ' ' %r km ') '
* get
the stn name, reference time, and distance from SAC header
* and
put them into the title
fileid l
ul
fileid t
l kcmpnm
*
display the component name
* fileid
Controls the file id display found on most SAC plots.
* TYPE
LIST hdrlist : Define a list of header fields to display in
the
* fileid.
*
LOCATION UL : Place file id in upper left hand corner.
Perintah
envelope untuk
membalikkan sinyal 90 derajat atau menjadikan bernilai positif dengan transformasi Hilbert.
Gambar 1. Tabel Jeffery Bullens


Komentar
Posting Komentar